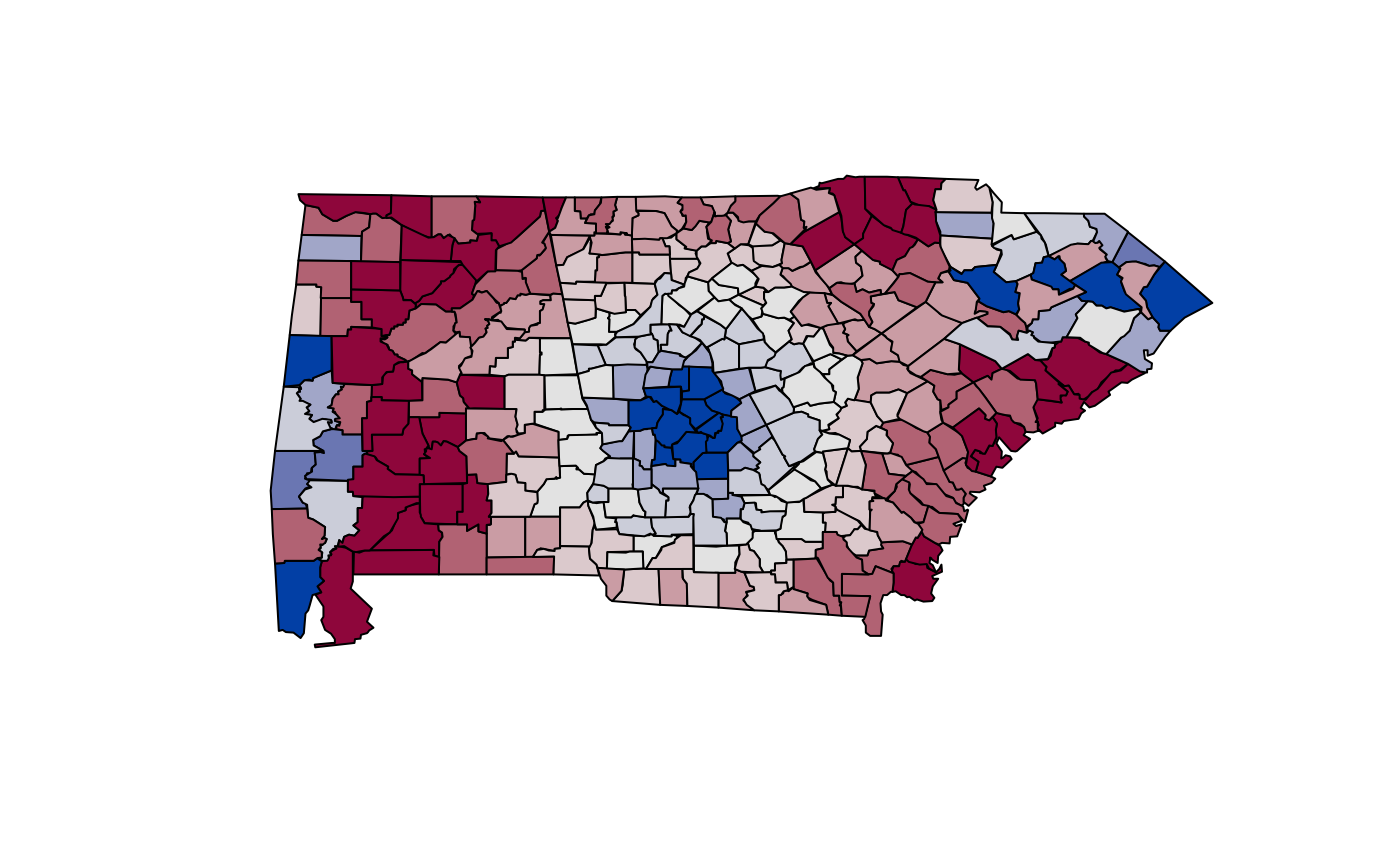
Polygon for County Map of US South States: Alabama, Georgia, and South Carolina
USSouthPolygon.RdCounty polygons for Alabama, Georgia, and South Carolina plus an artifical variable used for coloring.
data("USSouthPolygon")Format
A data frame with coordinates of the vertices of the county polygons
(x, y) and an artificial variable z constructed for
illustrating colored maps.
Source
Polygon data taken from maps package of Becker, Wilks, Brownrigg, and Minka (2012). Version 2.2-6. https://CRAN.R-project.org/package=maps
Examples
## generate color palette
pal <- diverging_hcl(9)
n <- length(pal)

## draw shaded polygons
plot(0, 0, type = "n", xlab = "", ylab = "", xaxt = "n", yaxt = "n", bty = "n",
  xlim = c(-88.5, -78.6), ylim = c(30.2, 35.2), asp = 1)
polygon(USSouthPolygon, col = pal[cut(na.omit(USSouthPolygon$z), breaks = 0:n/n)])