HCL-Based Continuous Qualitative Color Scales for ggplot2
scale_colour_continuous_qualitative.RdContinuous ggplot2 color scales using the color palettes generated by qualitative_hcl. These scales are provided
for completeness. It is not normally a good idea to color a continuous variable using a qualitative scale.
scale_colour_continuous_qualitative(
  palette = NULL,
  c1 = NULL,
  l1 = NULL,
  h1 = NULL,
  h2 = NULL,
  alpha = 1,
  rev = FALSE,
  begin = 0,
  end = 1,
  na.value = "grey50",
  guide = "colourbar",
  aesthetics = "colour",
  n_interp = 11,
  ...
)

scale_color_continuous_qualitative(
  palette = NULL,
  c1 = NULL,
  l1 = NULL,
  h1 = NULL,
  h2 = NULL,
  alpha = 1,
  rev = FALSE,
  begin = 0,
  end = 1,
  na.value = "grey50",
  guide = "colourbar",
  aesthetics = "colour",
  n_interp = 11,
  ...
)

scale_fill_continuous_qualitative(..., aesthetics = "fill")
Arguments
- palette
The name of the palette to be used. Run
hcl_palettes(type = "qualitative")for available options.- c1
Chroma value, used for all colors in the scale.
- l1
Luminance value, used for all colors in the scale.
- h1
Beginning hue value.
- h2
Ending hue value.
- alpha
Numeric vector of values in the range
[0, 1]for alpha transparency channel (0 means transparent and 1 means opaque).- rev
If
TRUE, reverses the order of the colors in the color scale.- begin
Number in the range of
[0, 1]indicating to which point in the color scale the smallest data value should be mapped.- end
Number in the range of
[0, 1]indicating to which point in the color scale the largest data value should be mapped.- na.value
Color to be used for missing data points.
- guide
Type of legend. Use
"colourbar"for continuous color bar.- aesthetics
The ggplot2 aesthetics to which this scale should be applied.
- n_interp
Number of discrete colors that should be used to interpolate the continuous color scale. 11 will work fine in most cases.
- ...
common continuous scale parameters: `name`, `breaks`, `labels`, and `limits`. See
continuous_scalefor more details.
Details
If both a valid palette name and palette parameters are provided then the provided palette parameters overwrite the parameters in the named palette. This enables easy customization of named palettes.
Examples
library("ggplot2")
# none of these examples are necessarily good ideas
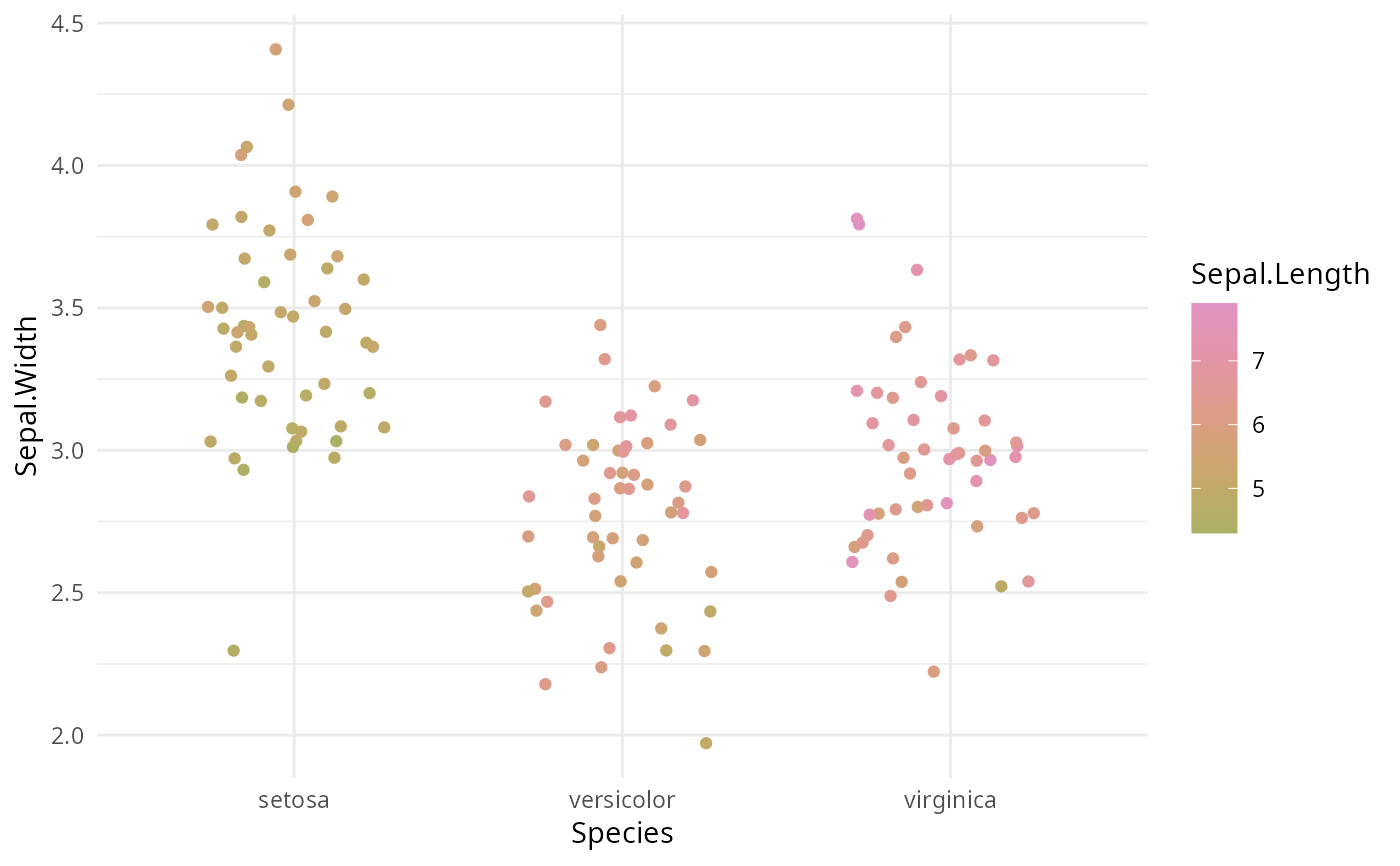
gg <- ggplot(iris, aes(x = Species, y = Sepal.Width, color = Sepal.Length)) +
geom_jitter(width = 0.3) + theme_minimal()
gg + scale_color_continuous_qualitative(palette = "Warm")
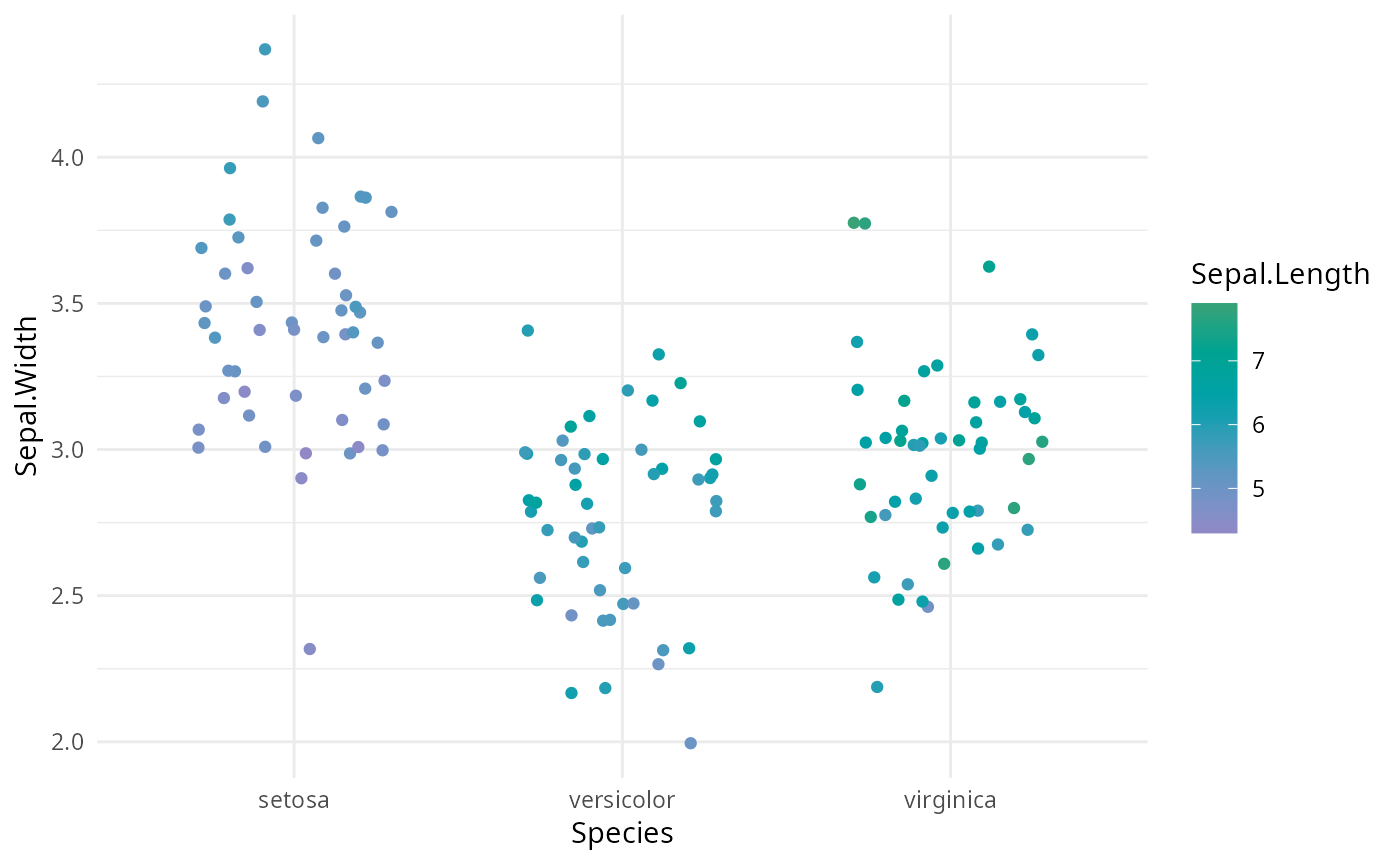
 gg + scale_color_continuous_qualitative(palette = "Cold", l1 = 60)
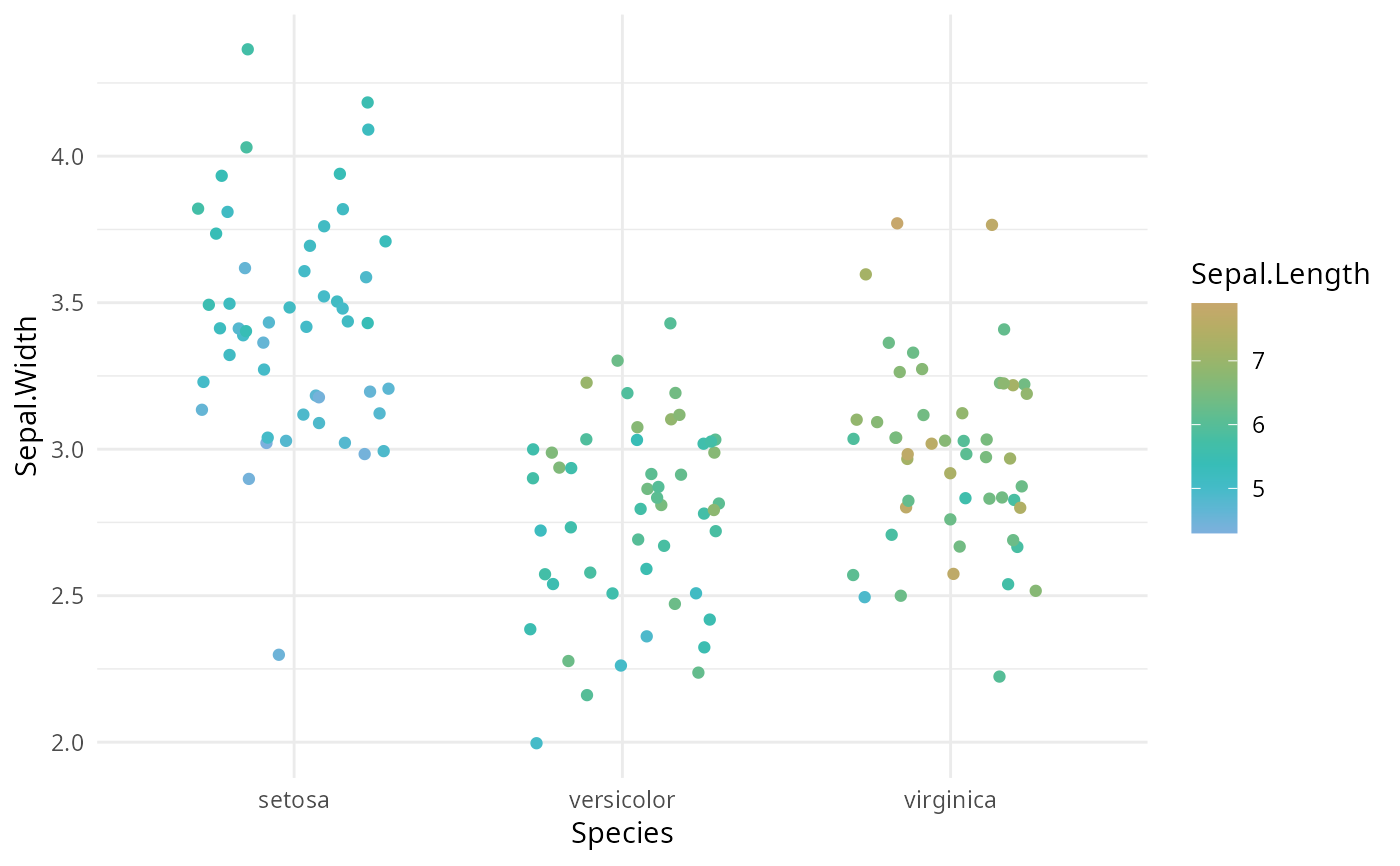
 gg + scale_color_continuous_qualitative(palette = "Harmonic", rev = TRUE)
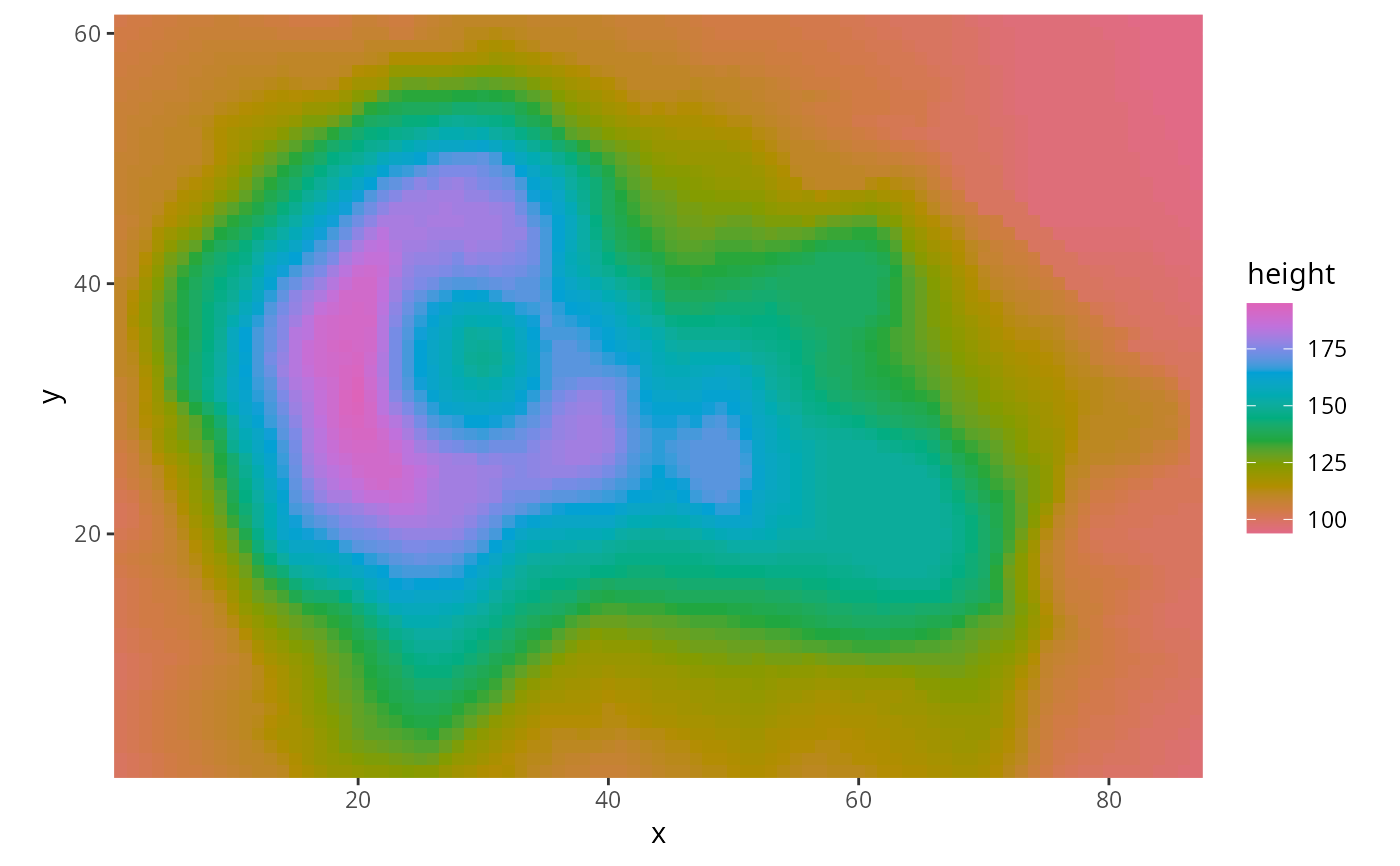
 nx = 87
ny = 61
df <- data.frame(height = c(volcano), x = rep(1:nx, ny), y = rep(1:ny, each = nx))
ggplot(df, aes(x, y, fill=height)) +
geom_raster() + scale_fill_continuous_qualitative(palette = "Dark 3") +
coord_fixed(expand = FALSE)
nx = 87
ny = 61
df <- data.frame(height = c(volcano), x = rep(1:nx, ny), y = rep(1:ny, each = nx))
ggplot(df, aes(x, y, fill=height)) +
geom_raster() + scale_fill_continuous_qualitative(palette = "Dark 3") +
coord_fixed(expand = FALSE)