Apps for Choosing Colors and Palettes Interactively
hclwizard.RmdOverview
To facilitate exploring the package and employing it when working with colors, several graphical user interfaces (GUIs) are provided within the package as shiny apps (Chang et al. 2020). All of these GUIs/apps can be run locally from within R and are also provided at https://hclwizard.org/.
-
Palette constructor:
choose_palette()orhclwizard()orhcl_wizard(). -
Color picker:
choose_color()or equivalentlyhcl_color_picker(). -
Color vision deficiency emulator:
cvd_emulator().
In addition to the shiny version, the palette
constructor app is also available as a Tcl/Tk GUI via the R package
tcltk shipped with base R (R Core Team 2020). The tcltk
version can only be run locally and is considerably faster while the
shiny version has a nicer interface with more features and can
be run online. The choose_palette() function by default
starts the tcltk version while
hclwizard()/hcl_wizard() by default start the
shiny version.
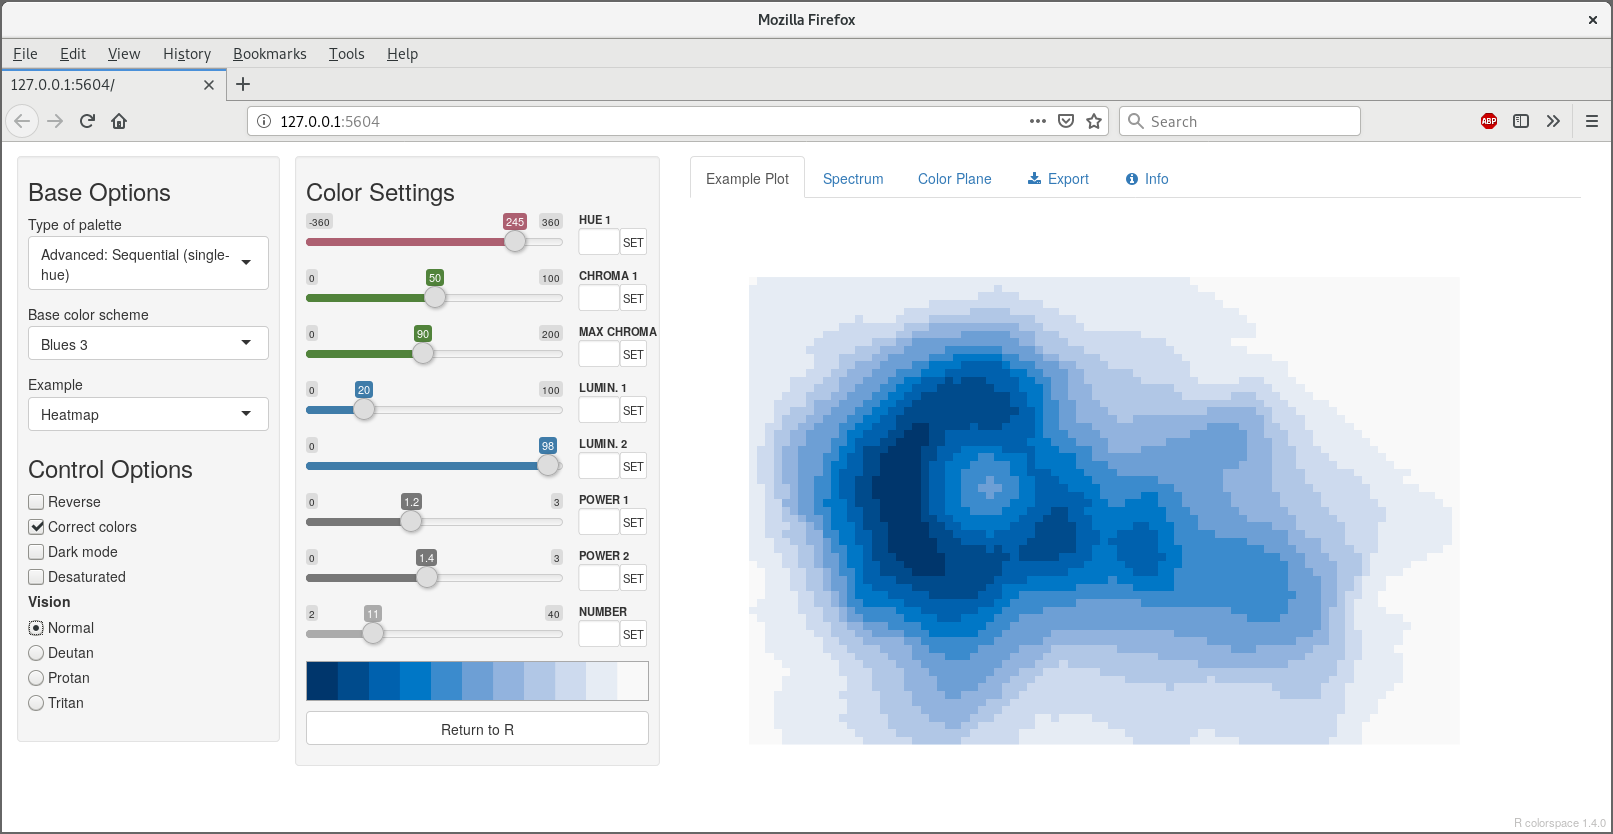
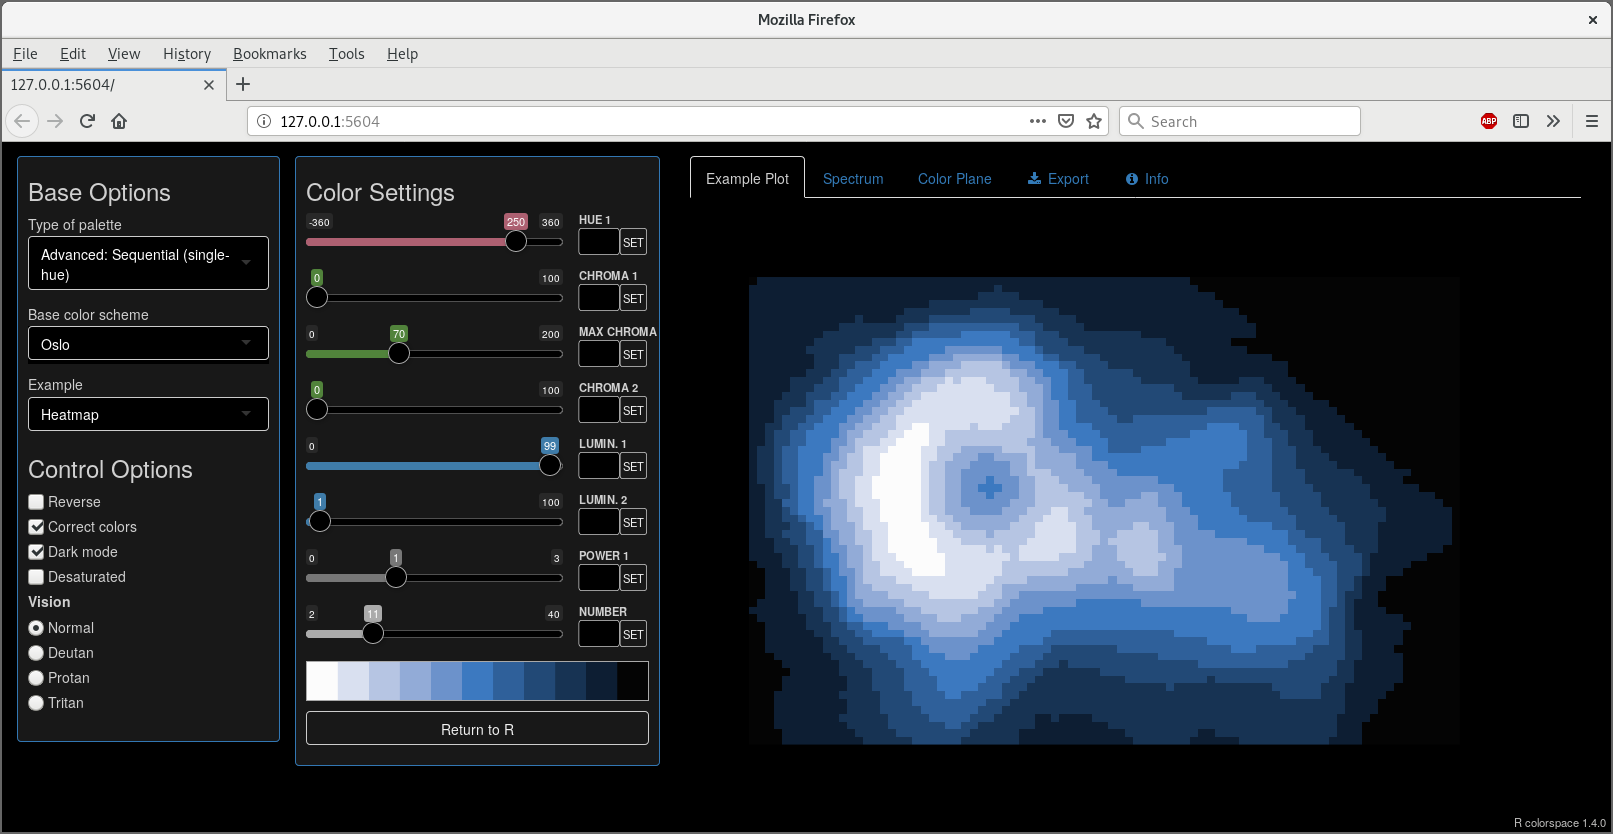
Choose palettes with the HCL color model
The palette constructor GUI can either be started with
hclwizard() (or equivalently hcl_wizard())
which by default starts the shiny version:
The tcltk version is started by default with
choose_palette():
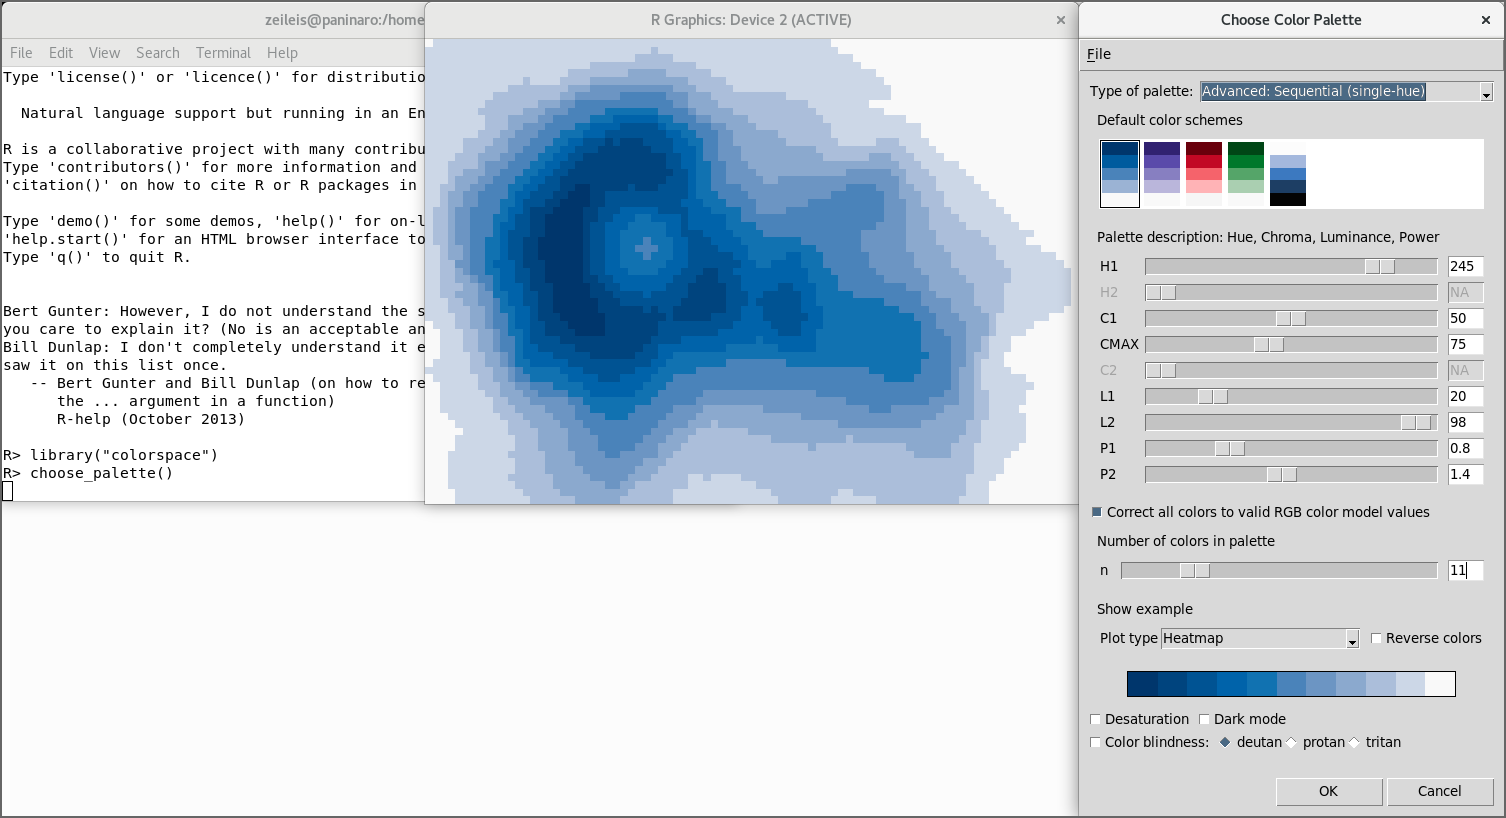
However, all defaults can be modified by setting
gui = "tcltk" or gui = "shiny".
The GUIs interface the palette functions
qualitative_hcl() for qualitative palettes,
sequential_hcl() for sequential palettes with single or
multiple hues, and diverging_hcl() for diverging palettes
(composed from two single-hue sequential palettes). See the discussion
of HCL-based color palettes for more
details.
The GUIs allow for interactive modification of the arguments of the
respective palette-generating functions, i.e., starting/ending hue
(wavelength, type of color), minimal/maximal chroma (colorfulness),
minimal/maximal luminance (brightness, amount of gray), and power
transformations that control how quickly/slowly chroma and/or luminance
are changed through the palette. Subsets of the parameters may not be
applicable depending on the type of palette chosen. See
qualitative_hcl() and Zeileis et al.
(2009) for a
more detailed explanation of the different arguments. Stauffer et al. (2015) provide
more examples and guidance.
Optionally, the active palette can be illustrated by using a range
of examples such as a map, heatmap, scatter plot, perspective 3D
surface etc. To demonstrate different types of deficiencies, the active
palette may be desaturated (emulating printing on a grayscale printer)
and collapsed to emulate different types of color-blindness (without
red-green or green-blue contrasts) using the simulate_cvd()
functions. To facilitate generation of palettes for black/dark
backgrounds, a “dark mode” of the GUIs is also available:
Choose individual colors with the HCL color model
This GUI can be started with either choose_color() or
equivalently hcl_color_picker().
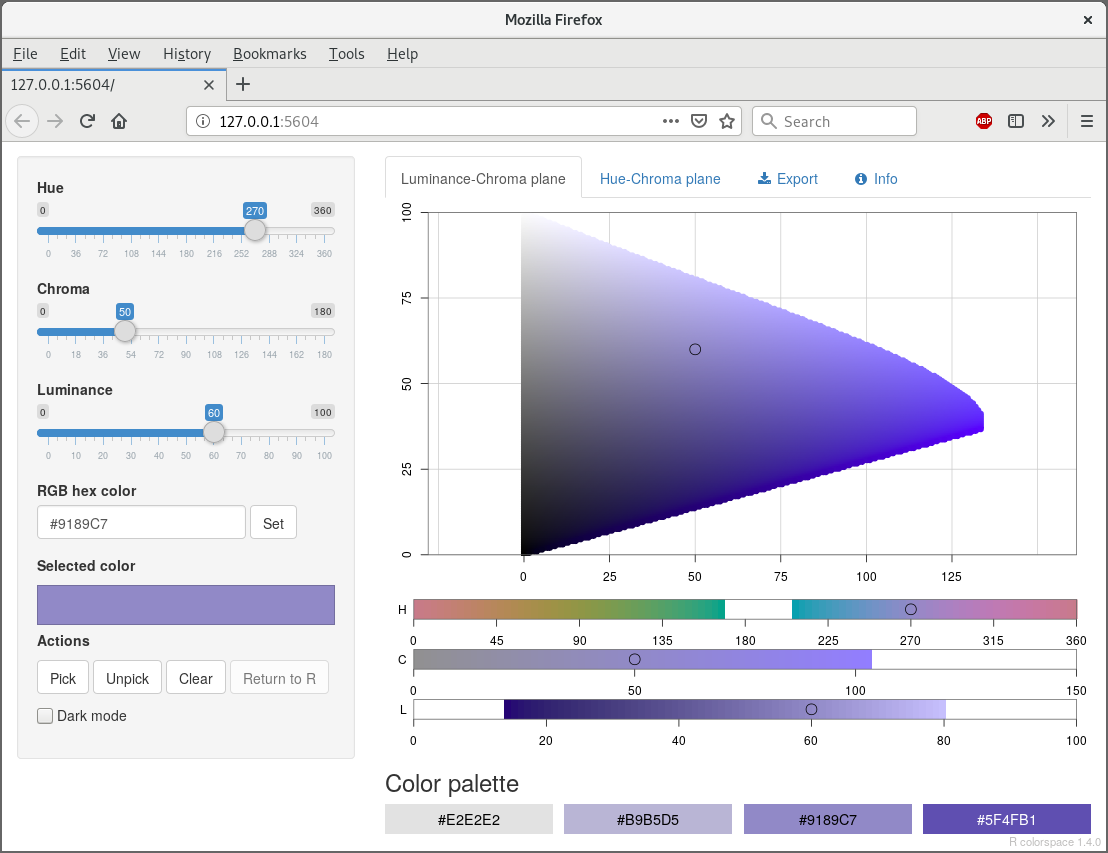
It shows the HCL color space either as a hue-chroma plane for a given luminance value or as a luminance-chroma plane for a given hue. Colors can be entered by:
- Clicking on a color coordinate in the hue-chroma or luminance-chroma plane.
- Specifying the hue/chroma/luminance values via sliders.
- Entering an RGB hex code.
By repeating the selection a palette of colors can be constructed and returned within R for subsequent usage in visualizations.
Emulate color vision deficiencies
This GUI can be started with cvd_emulator().
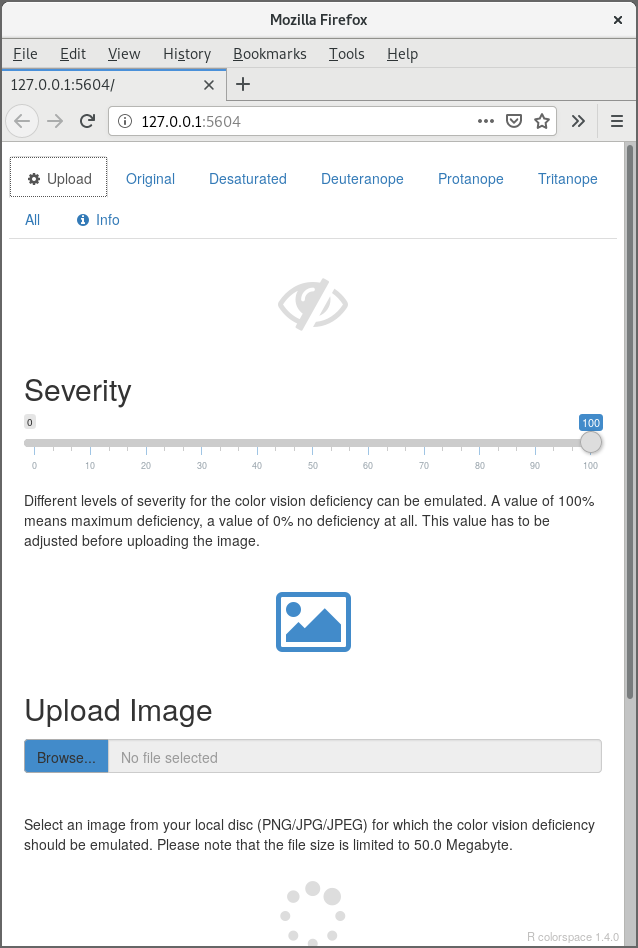
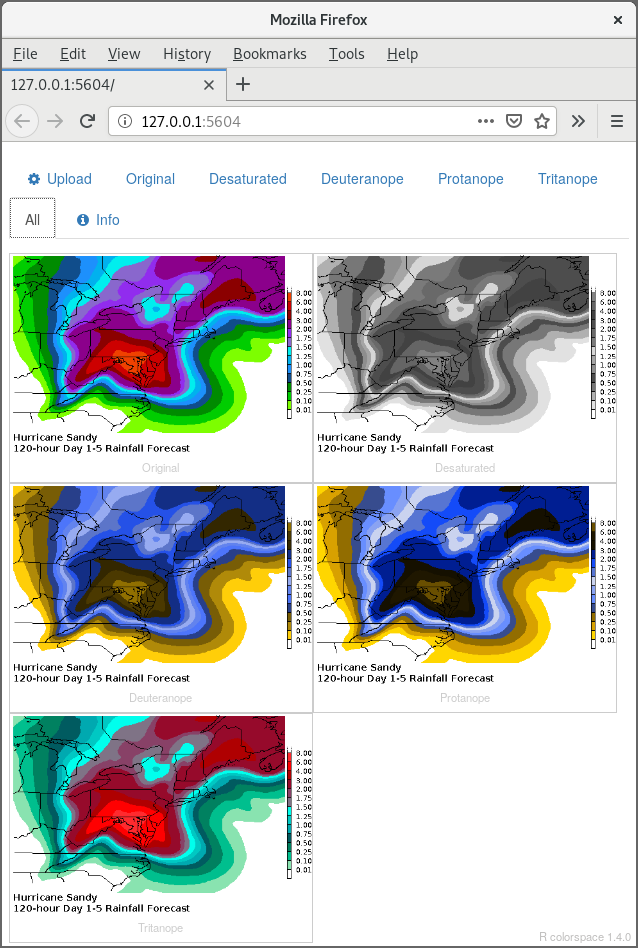
The GUI supports uploading a raster image in JPG or PNG format which is then checked for various kinds of color vision deficiencies at the selected severity. By default the severity is set to 100% and all supported kinds of color vision deficiency are checked for, i.e.,
- Monochromatic (desaturated grayscale).
- Deuteranope vision (green deficient).
- Protanope vision (red deficient).
- Tritanope vision (blue deficient).